Today's initial jobless claims printed at 404k, "way better" than the estimate of 405k. That means the economy is going to get better and banks will start crediting again. Is that so?
Let's take a closer look on how the Department of Labor arrives at this particular figure:
There are the Initial Jobless Claims which represent how many new people filled for the first time for jobless claims, and there are the Continuing Jobless Claims which reveals the total number of jobless claims. The first figure is the flow and the second is the stock. Taken from the most recent report on joblessness:
SEASONALLY ADJUSTED DATA
In the week ending October 8, the advance figure for seasonally adjusted initial claims was 404,000, a decrease of 1,000 from the previous week's revised figure of 405,000. The 4-week moving average was 408,000, a decrease of 7,000 from the previous week's revised average of 415,000.
Which basically means that there were 1k less claims for unemployment. A pretty high number if you compare it with the Continuous Jobless Claims, right ? Wrong.
UNADJUSTED DATA
The advance number of actual initial claims under state programs, unadjusted, totaled 398,836 in the week ending October 8, an increase of 66,442 from the previous week. There were 462,667 initial claims in the comparable week in 2010.
The total number of people claiming benefits in all programs for the week ending September 24 was 6,821,585, a decrease of 39,203 from the previous week.
Those are 6,821,585 Americans claiming unemployment benefits. So there must be almost 7 million Americans unemployed, right? Wrong again. The number of people currently not working is not calculated by the Labor Department. What they exclude from the unemployment rate are:
1. Discuraged people who gave up looking for work2. Underemployed people3. People doing unpaid work4. People working in lower paid jobs (flipping burgers at McDonalds or sweeping floors at Walmart)5. People in prisons (as there is a small but significant correlation between unemployment and crime)6. Those retired before their retirement age
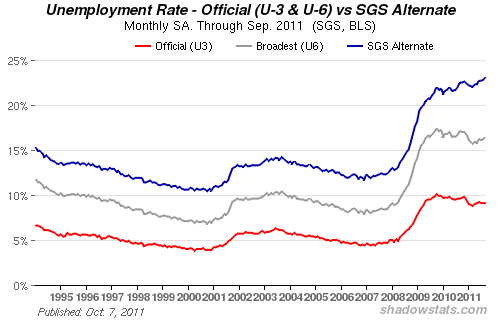
There is an indicator calculated by the Department of Labor which is widely ignored, even though it includes the underemployed and the discuraged workers. It is known as the U-6 and it revolves around 16.6%. The indicator was first calculated in 1996, as lobbied by economists to have a comparable figure to the European unemployment rate.
Even the broadest measure of unemployment calculated by the US Government leaves out some jobless Americans. The real unemployment rate, as measured by ShadowStats is:
Furthermore, as the unemployment rate is a statistical indicator, it is subdued to be:
1. Seasonally adjusted2. Aproximated from a statistical sample (a Gallup survey sample)3. Revised on a continuing basis4. Prone to measurement errors5. other statistical errors
This makes the case against the relevance of the initial and continuous jobless claims as baromethers of the overall economic health of a country. What they really measure is the fiscal burden of the Government when paying these unemployment benefits. When taking into account all the excluded cathegories, the real employment rate, as measured by Shadowstats goes from the official 9.1% to a staggering 16.6% U-6 rate and up to a mind-boggling 22.4% real unemployment rate. Which figure depicts the real economic state of the US ?


No comments:
Post a Comment